 | IMPACT OF THE NETWORK ADJUSTMENT APPLICATION ON THE RESULTS |
This web page brings togheter the collaborative work carried out since 2017 by different people from different institutions or companies to study the compatibility and the interoperability among network adjustment applications.
This work has two main objectives.
First, to better understand how it is possible to obtain similar results from different applications using the same measurements. This question arises mainly in case of software replacement, or in case of collaboration purposes betwenn people using different software.
Next, to effectively quantify and study the impact of the application on the results, mainly on the adjusted coordinates and the residual values.
Our approach is a very classical one. The same measurements are processed by all the applications. The comparison criteria are the discrepancies on the estimated coordinates and the estimated variance factor, as a summary of the residuals.
So far, we use simulated measurements instead of in field ones. This allows us to fully control the content of the measurements, in particular the mathematical models in use to obtain the theoretical value, but also the behavior and the properties of the random error added to this theoretical value. This also allows us to control the geometry of the network, and to build sets of networks where a geometrical parameter can vary (scale, location, and so on), to study the impact of this particular varying parametere on the results.
I. Applications currently included in the study
Both institutional and commercial applications are included in this study. We are continually seeking to integrate new software. Do not hesitate to contact us is you want to collaborate to this work.
Columbus (version: 4.6.2.41 )
http://bestfit.com
-- Data processing and results provided by Stéphane Durand (Cnam/GeF)
Commercial software from the Sweco company.
CoMeT - Compensation de Mesures Topographiques (version: 2017.02.14)
comet.esgt.cnam.fr
-- Data processing and results provided by Stéphane Durand (Cnam/GeF)
Network adjustment application developped by the Land and Law laboratory (laboratoire Géomatique et Foncier) of the Conservatoire national des arts et métiers since 2007.
Comp3D (version: 4.3.8)
© IGN, © Soldata
-- Data processing and results provided by Stéphane Durand (Cnam/GeF)
Comp3D is the pre-analysis and adjustment application developped by the French National Institute of Geographic and Forest Information (IGN).
Comp3D (version: 5.23)
© IGN
-- Data processing and results provided by Stéphane Durand (Cnam/GeF) - preliminary results jan 2025
Comp3D is the pre-analysis and adjustment application initially developped by the French National Institute of Geographic and Forest Information (IGN).
It is described as a micro-geodesy compensation application that enables computation on a limited spread network of few kilometers.
Since version 5, Comp3D is distributed as an open-source software : https://github.com/IGNF/Comp3D.
Geolab (versions: 2001 and PX5 )
https://www.geolabsolutions.com
-- Data processing and results provided by Stéphane Durand (Cnam/GeF)
Commercial software from the Geolab Solution company.
JAG3D - Java Applied Geodesy 3D (versions : 20210701 (ellipsoidal approach) and 20210627 (spherical approach))
https://software.applied-geodesy.org
-- Data processing and results kindly provided by Michael Lösler --
JAG3D is an open source least-squares software package for geodetic and metrological sciences, developed at the Frankfurt University of Applied Sciences.
LGC - Logiciel Général de Compensation (version: 2.01.00)
-- Data processing and results provided by Mark Jones (CERN/BE-Dept)
LGC is the pre-analysis and adjustment application developped at CERN in the 1980s.
Move3 (version: 4.5.1 x64 Demo )
https://move3software.com/
-- Data processing and results provided by Stéphane Durand (Cnam/GeF)
Move3 is a commercial application from the Sweco company.
Star*Net (version: 10 v10.0.15.974 x64 Demo )
https://www.microsurvey.com/products/starnet/
-- Data processing and results provided by Stéphane Durand (Cnam/GeF)
Star*Net is a commercial application from the Microsurvey company.
Trinet+ (version: 7.2)
-- Data processing and results provided by Sébastien Guillaume, Paul-Henri Cattin, Thomas Touzé (Heig-VD) and Stéphane Durand (Cnam/GeF) --
The Trinet+ application was developed in 2002 by S.Guillaume and P. H. Cattin, and has been used since then at the School of Management and Engineering Vaud (HEIG-VD) for teaching and research purposes.
II. Impact of the size (side length) of the network
In this study, the main idea is to generate measurements in networks sharing the same shape, but at different scales
Generation of simulated measurements
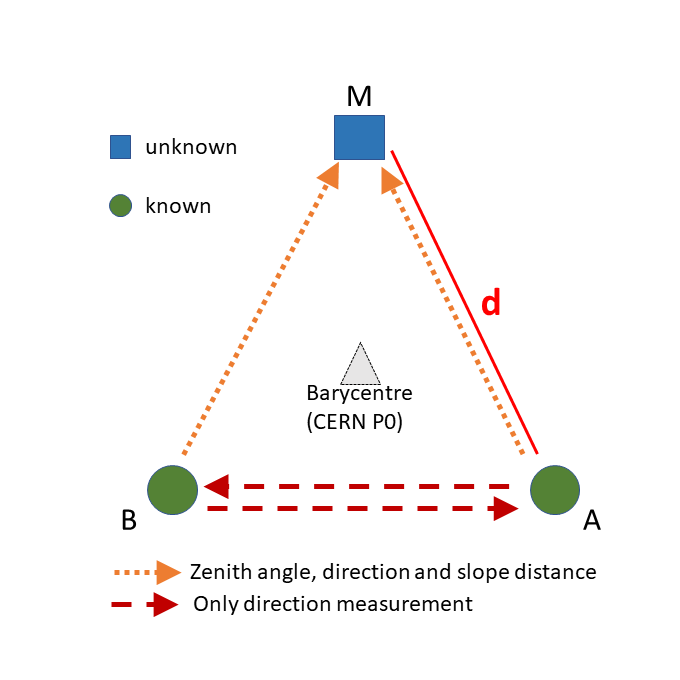 |
The starting point is a equilateral triangular network in the local horizontal plane, with barycenter G and a varying side length d. In this triangle, two points have known coordinates (A and B), and the third point M is unknown. Point M is located along the North direction. A vertical offset of +10 meters is added to point A, and a vertical offset of -10 m to point B. |
The principal point P0 at CERN is the barycentre of all our test networks. Geodetic latitude and longitude for point P0 are 51.3692 and 6.72124 grads with respect to the CERN Geodetic Reference Frame (CGRF) (the reference frame tied to the reference IAG GRS 80 ellipsoid). For P0, the ellipsoidal height is defined to be 433.65921 m and the geoidal undulation is zero.
In order to generate coordinates for our test networks, we defined a P0 point which have the same definition in ERTF89 than the CERN P0 point in the CGRF: same values for latitude, longitude and ellipsoidal height with no geoidal undulation with respect to IAG GRS 80 ellipsoid. The following table summarizes the ETRF89 coordinates of this P0 point:
| Ellipsoidal coordinates (wrt. IAG GRS80) | Cartesian coordinates | ||||
| Latitude | 51.3692 grads | 46°13′56.21′′ N | X | 4395400.3638 m | |
| Longitude | 6.72124 grads | 006°02′56.82′′ E | Y | 465785.0567 m | |
| Ellipsoidal height | 433.65921 m | Z | 4583458.2260 m | ||
The CoMeT application is used to generate measurements in all the test networks. A Gaussian error is added to the computed theoretical observation values, in a particular way quickly explained in XYZ n°158 - 2018 (in french), and with more details in JISDM2022 paper.
The main parameters used for the generation and the processing of the measurements are:
| Refraction coefficient | none |
| Standard deviation (angle measurements) | 0.3 mgrad |
| Standard deviation (slope distance) | 5 mm |
| Convergence criterium | 0.1 mm |
Test networks datasets
For each simulated network, identified by its side length, point coordinates (ETRS89 geodetic Cartesian coordinates) and generated observations between points are freely availaible:
Webpage summarizing the datasets: datasets webpage
Dissemination of the results
In 2020, a common research paper was published in the Journal of Surveying Engineering (J. Surv. Eng. 2020 paper). It explained the comparison methodology and presented results on the impact of the side length of the network on three software: CoMeT, LGC and Trinet+.
In 2022, a common conference paper was proposed to the JISDM 2022 symposium (JISDM2022 paper). Using the same datasets as in the 2020 paper, results on the impact of the side length of the network on several software: Columbus, CoMeT, Geolab, JAG3D, LGC, Move3, Star*Net and Trinet+.
It is also possible to interactively access to the results throught an interactive tool. For each application integrated in the study, it is possible to access to the estimated variance factor, 2D horizontal distance between estimated and theoretical coordinates and coordinate difference in the vertical component
III. Impact of a vertical difference among points
In this study, the starting point is the triangular network with side length d=500 m used in the previous study. In this network, the ellipsoidal height of point M is modified to study the impact of a height difference between points on the results.
Generation of simulated measurements
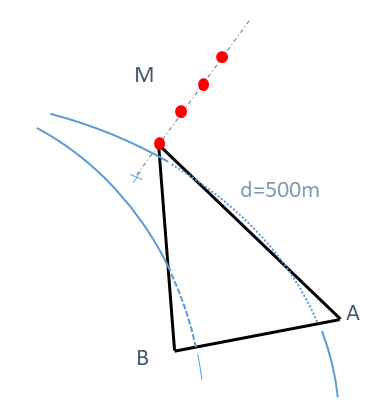 |
The generation process of the measurements for the sets of networks used in this study is the same as in the previous study.. Starting from the ETRS89 Cartesian coordinates of the triangular network with side length d, we only modify the ellipsoidal heigth (w.r.t. IAG GRS80 ellipsoid) and before generating measurements, still using the 3D-mathematical models of the CoMeT application, with an ellipsoidal approach. |
Test networks datasets
For each simulated network, identified by its offset value on the ellipsoidal height of point M, point coordinates (ETRS89 geodetic Cartesian coordinates) and generated observations between points are freely availaible:
Webpage summarizing the datasets: datasets webpage
Dissemination of the results
In 2022, a common conference paper was proposed to the JISDM 2022 symposium (JISDM2022 paper). In this contribution, results on the impact of the vaiation of the ellipsoidal height of point M were presented for the following applications: Columbus, CoMeT, Geolab, JAG3D, LGC, Move3, Star*Net and Trinet+.
It is also possible to interactively access to the results throught an interactive tool. For each application integrated in the study, it is possible to access to the estimated variance factor, 2D horizontal distance between estimated and theoretical coordinates and coordinate difference in the vertical component
IV. Impact of the geometry of the network
For this study currently in progress, we seek to complicate the geometry of the tested networks: shape, number of points, type of measurements, and so on.


